The Nevada NSF EPSCoR 2015 Annual Meeting & External Advisory Committee Meeting
Graduate Student Poster Session

Research Posters
Electricity generated from solar panels and concentrating troughs is becoming increasingly used. However, the natural process of soiling of solar installations causes a continuous decrease of their power output, thus requiring cleaning with water or mechanical methods. In this research, different water types will be used as potential cleaning agents for soiled surfaces of PV panels or concentrating mirrors. Distilled water, brackish ground water and reused water will be employed, adding surfactants in some tests to check if the cleaning action is enhanced. In addition to measuring the output power after each cleaning, assays will be performed to test for film and scale-forming constituents that may affect the PV or solar concentrating surfaces.
One of the objectives of the research is to verify whether some types of water will permit us to attain significant water savings when cleaning the surfaces of PV panels and concentrating surfaces. Every time the panels are washed, each type of cleaning water will be tested for deposition of solids and possible negative effects. The results of this research will permit to establish the feasibility of using ground brackish water and reused water for effectively cleaning the surfaces of PV cells and solar and concentrating mirrors.
Poster #2
K. Moutafis
Mentor: Dr. E. A. Yfantis, Professor of CS, UNLV
Department of Electrical & Computer Engineering, University of Nevada, Las Vegas
Sunlight is comprised of ultraviolet, visible, and infrared light. For now we will only focus on the visible spectrum. White light from the sun is comprised of all colors in the visible spectrum. Each color is distinguished by their different wavelengths, where violet and blue are short, yellow and red are long, and green is in the middle. Different molecules and particles in the atmosphere affect different components of white light, and these phenomena are explained by Rayleigh scattering and the Mie solution to Maxwell’s equation. Rayleigh scattering applies to particles that are much smaller than the wavelength, where shorter wavelengths scatter more than longer ones. The Mie solution to Maxwell’s equation applies to particles similar to or larger than the wavelength, where all wavelengths of white light scatter equally. The color of the sky is indicative of how clean or dirty the air is. Solar output depends on the time of day, month, of year, and climatological conditions. In terms of climate, dust storms and sand storms are common in arid climates, and as the dust settles on the glass of a solar panel, the energy output decreases, because part of the light is refracted by the dust and less light penetrates the glass. The loss of light energy depends on the amount, size, and chemical composition of the dust. In terms of time, trees are sparse in arid climates, and as birds migrate in the fall and spring, solar farms are used by them as rest areas; therefore, the solar panels become dirty by bird excrement. In general, this is a problem year round. Bird droppings are worse than dust, because no light passes through them. It is safe to say that the dirtier a panel is, the less energy it produces. The classification algorithm involves sampling, determining the classification vector, and developing, training, and testing a classifier. Our goal is to use videos of solar panel surfaces captured by cameras from a solar panel site and classify the solar panels as clean or dirty.
Dust deposition can have a significant impact on the efficiency of solar collectors. Specific information is needed on dust composition, generation, and adhesion mechanisms in order to develop adaptive management strategies. If we can determine the chemical composition and particle morphology of dust, we can determine if the source is local vs. regional, or global. This characterization will also help determine the chemical interactions between the particles and various surfaces and should aid in understanding the role of dust in light attenuation as well as in developing cleaning protocols for solar collection devices. A variety of sampling techniques were employed to obtain particulate matter for characterization. These techniques included high/low volume air sampling, collection of dust fallout, and direct collection from solar devices and Vugs. Various analytical methods were used to characterize atmospheric particulates that can deposit on the surface of solar devices. These methods included: Raman Spectroscopy, High Performance Liquid Chromatography, Scanning Electron Microscopy X-ray Microanalysis, and Pyrolysis Gas Chromatography Mass Spectrometry. This has allowed us to identify several different minerals as well as obtain information on the organic matter present. In addition, we plan to examine particle distribution, size distribution, and trace metal concentration.
A variable-frequency drive (VFD) is an electronic controller that adjusts the speed of an electric motor by modulating the supply voltage and frequency. VFDs are enjoying rapidly increasing popularity at water and waste-water facilities, as they draw less energy while still meeting pumping needs. In addition to saving energy, VFDs offer several other advantages including “soft start” capability which lessens mechanical and electrical stress on the motor thus extending motor life, more precise control of processes, closer pressure tolerances in water distribution systems. However, because of the nature of this technology, VFDs can produce harmonic distortion on the utility side — which can affect the quality of power. On the motor side, VFDs cause other problems which stem from the high-frequency pulsed output voltage. Such pulses can be magnified by the impedance of the cable connecting the VFD to the motor thus putting high stress on the insulation. Furthermore, high-frequency common-mode voltages and currents may cause trouble with motor bearings. Both theoretical and experimental research will be conducted on how to prevent or reduce the severity of the above problems caused by VFDs.
State estimation is essential to monitor and control power networks and smart grids. This can be accomplished by utilizing aggregated data from conventional measurements, state-of-the-art phasor measurement units (PMUs) or measurements from other intelligent electronic devices (IEDs) such as smart meters. With the proliferation of PMUs and IEDs in smart power distribution networks, the size of aggregated data for state estimation increases dramatically. Thus, application of data compression techniques in future smart grids will be inevitable. In this study, we apply the information theoretic approach to distributed compressed sensing to compress the measured real and reactive powers of the loads in power distribution networks. The compressed data is decompressed in the power distribution control center and distribution state estimation is performed using the decompressed data. The proposed method was tested on an IEEE standard distribution networks. Simulation results show that due to strong spatial and temporal correlation between data from different loads, the measured data can be compressed by up to 70% by utilizing the proposed method.
Solar is a promising source of energy here in Nevada because of the high irradiance and geographic potential. Due to arid climate in Nevada, we seek improve water efficiency by using air-cooled heat exchangers in place of the wet cooling counterpart in the implementation of power generation via solar energy. Air cooled heat exchangers are devices used to reject heat using the ambient air and have historically been used in locations where large volumes of fresh cooling water is not readily available. In this effort we developed a comprehensive computational model to simulate both the external air side flow as well as the tube interior multiphase condensation flow and couple these to obtain a highly accurate model of the system. A novel numerical model for interfacial mass transfer was also introduced to govern the model for phase change and boundary growth. This study will better the understanding of the condensation phenomena while improving the potential for solar energy in desert climates.
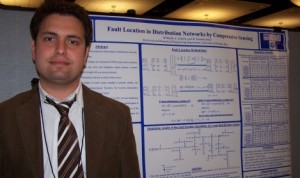
This poster proposes a novel method for fault location in distribution networks using compressive sensing. During- and pre-fault voltages are measured by smart meters along the feeders. The voltage sag vector and impedance matrix produce a current vector that is sparse enough with one nonzero element. This element corresponds to the bus at which a fault occurs. Due to limited number of smart meters installed at primary feeders, our system equation is underdetermined. Therefore, the ℓ1-norm minimization method is used to calculate the current vector. Primal-Dual interior point (PDIP) and Log Barrier Algorithm (LBA) are utilized to solve the optimization problem with and without measurement noises, respectively. Our proposed method is implemented on a real 13.8 kV, 134-bus distribution network when single-phase, three-phase, double-phase, and double-phase to ground short circuits occur. Simulation results show the robustness of the proposed method in noisy environments and satisfactory performance for various faults with different resistances.
Cyberinfrastructure Posters
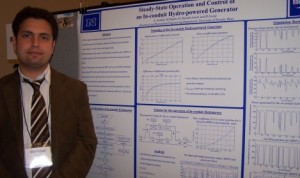
Water supply companies use pumping stations to boost water pressures in supply mains for fire fighting, high rise building, and to maintain water supply in water towers and storage tanks. Most plumbing codes require water pressure reducing valves (PRV) on domestic systems where the municipal water main’s pressure exceeds 80psi. Some of the energy loss across the PRV can be recovered by replacing the existing PRV with small hydroelectric turbines and generators. Decreasing the water pressure from 150 psi to 50 psi also reduces the water flows through the system and wastewaters. There is a need to develop a scheme to control the operation of the in-conduit hydro-powered generator for maximum efficiency which is the subject of this research.
Poster #9
Moinul Hossain and Banafsheh Rekabdar
Advisers: Dr. Sushil Louis and Dr. Sergiu Dascalu
University of Nevada, Reno
We investigate a deep learning Artificial Neural Network approach for creating weather forecast models using the climate data from the Nevada Climate Change Portal. Neural Networks are useful for modelling highly nonlinear and chaotic processes like weather. With the recent interest in deep learning Neural Networks, we explored the feasibility of a deep learning approach called Stacked Denoising Auto-Encoders for building forecast models that predict hourly air temperature. We considered historical hourly temperature, barometric pressure, humidity and wind speed data for building the model. We collected and processed the raw data from the Nevada Climate Change Portal subscribed sensors and use this data to empirically compare the performance of stacked denoising autoencoders against traditional neural nets at predicting temperature. Experimental test results show that, with a good choice of parameters, stacked denoising autoencoders achieved up to 98% accuracy in predicting temperature, beating traditional neural networks. Our results provide further empirical evidence of the broad applicability of deep neural networks.
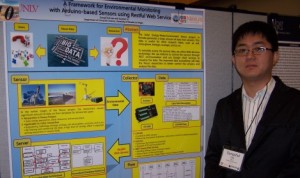
The Nevada Solar Energy-Water-Environment Nexus project generates a large amount of environmental monitoring data from variety of sensors. This data is valuable for all related research areas, such as soil, atmosphere, biology, and ecology. An important aspect of this project is promoting data sharing and analysis using a common platform. To support this effort, we developed a comprehensive architecture that can efficiently collect the data from various sensors, store them in a database, and offer an intuitive user interface for data retrieval. We employed Arduino-based sensors due to their flexibility and cost-effectiveness. Restful Web Service is used for communication with the Arduino-based sensors, and Google Charts service has been used for data visualization. This framework for sensor data monitoring with Web Service is expected to allow the Nevada Nexus project to seamlessly integrate all types of sensor data and to provide a common platform for researchers to easily share the data.
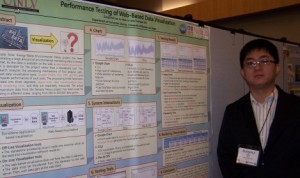
Many scientific applications generate massive data that requires visualization. For example, the Nevada Solar Energy-Water-Environmental Nexus project has been generating a large amount of environmental monitoring data in textual format. As the data is available on the web, a web-based visualization tool is desirable for the project rather than a standalone tool. This research analyzes the processing mechanisms of four popular web-based data visualization tools, that is, Google Charts, Flex, OFC, D3, and compares their performances. A standalone visualization tool, JfreeChart, have been also used for comparison. The processing times have been divided into three segments, layout time, data transformation time, and rendering time, and separately measured. The actual temperature data from the Nevada Nexus project has been used for testing in different scales ranging from 100 to 100,000 data points. The result shows that each visualization tool has its own ideal environment.
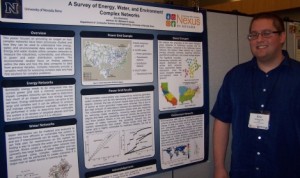
Complex networks can be used to get a better understanding of how energy, water, and environmental data relate to each other and to find patterns within the data. We focus on providing a detailed overview of some of the previous studies that use complex networks to study data in these areas. Many of the energy and water studies utilized complex networks to measure the robustness, vulnerability, and efficiency of the distribution systems. The environmental studies focused on discovering patterns within the data and compared them to data from previous decades. These studies show that complex networks provide a versatile method for analyzing complex data and understanding how all of the data relates to each other. The use for complex networks is growing and many more studies will have to be done to not only find solutions to real world problems, but also get a better understanding of the relationships within the data.
Poster #13
Eric Klukovich and Esra Erdin
Advisors: Dr. Mehmet H. Gunes and Gurhan Gunduz
Computer Science and Engineering, University of Nevada, Reno
A growing concern for end users of online social networks (OSN) is the privacy and control of user data due to the client-server architecture of the current ecosystems. We introduce Personal Online Social Network (POSN), a privacy preserving decentralized social network platform, which mimics real life social interactions. In particular, we decentralize the OSN platform and give direct control of the information to the user. The distributed platform removes central authorities from the OSN and users share their content only with intended peers through mobile devices. This decentralized system ensures that interaction happens between friends and third parties cannot access the user content or relationships. To be able to efficiently share objects and provide timely access in the POSN platform, we take advantage of free storage clouds to distribute encrypted user content. The combination of phone-to-phone applications with cloud infrastructure would address the main limitation of peer-to-peer systems, i.e., availability, while enjoying the benefits of peer-to-peer systems, i.e., no central authority and scalability.
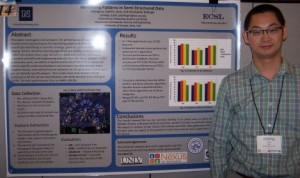
This paper investigates and compares the performance of supervised machine learning techniques for identifying patterns in semi-structured data, specifically identifying a real time strategy game player from their playing history. Machine learning algorithms are widely used to extract useful information from large datasets or databases and our techniques extend to scientific and engineering datasets from the Nexus project. In this preliminary work, we collect a representative set of StarCraft II replays for several specific professional players and compare boosted decision trees, random forests, and artificial neural networks on this gameplay data to see if we can identify specific players. Test results show that random forests achieved an 87.6% correct identification rate while decision trees only gets 79.9%. The best performance from an ANN is 84.6%.
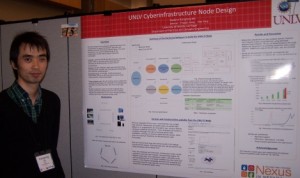
We have designed and deployed a Cyberinfrastructure (CI) Cloud Cluster to support the Nexus research group. A new cloud architecture has been proposed and implemented based on the study of requirements and current computing technology.
At hardware level, powered with 96 Intel Xeon processor cores, the cluster is able to store and process large data-sets efficiently by distributing tasks among 10 servers simultaneously; On software side, we have build a highly optimized GNU/Linux operating system, bundled with Bigdata processing engine and scientific computing pack. We have gain an average 10-20% performance increase and up to 35X performance boost in some critical scientific computing package.
While we will continue work on connectivity with NCDC and field sensors to get data, we also planned to develop a series of tutorials to our research community about how to use this platform, with the hope that these new tools and technology would made a boost to our current and future research.
The software process model has become more and more significant these days because it helps developers save time, ensure product quality, make management easier, enable project visibility, and reduce risks pertaining to software development. However, there are some shortcomings with traditional software process models. For example, when new requirements arise later in the project, waterfall is not flexible enough to accommodate them by moving back to an earlier phase. In this study, we present an overview of over 80 scientific papers focused on software process models, and propose a classification of such processes in four categories, based on their main emphasis: maintainability, efficiency, dependability, and acceptability. The maintainability segment encompasses flexibility and extensibility. The efficiency group includes high speed development, large tasks and large group collaborations, extensive reuse, and choosing the best software process models for given projects. The dependability segment covers robustness and security. The acceptability group consists primarily of solutions for avoiding user errors and increasing the user experience. Based on the survey conducted, we identified several research trends in software process models, which are also outlined in the poster.
With a foresight of depleting fossil fuels many nations are adding renewable resources to their energy portfolios such as geothermal, wind energy, and solar energy. Although solar energy harvesting has been around for a while, it is not until recently that it has gained interest as a renewable energy resource especially in the areas of year around bright sunshine. The Southwestern United States count as one of the best places in the world to collect solar energy, and Nevada is already harnessing the sun’s energy on a large scale. Generally, Solar energy has lots of positive environmental impacts such as reductions in emissions of greenhouse gases, reduced transmission lines from the electricity grids, etc. Depending on the size and type of the installation and location, there can be various environmental implications of such land cover change and sometimes however, it has to face potential negative environmental implications. These potential problems must be addressed and handled with care.
This study is conducted at three Utility-Scale Solar Facilities (USSE) areas: Nevada Solar One, Ivanpah Solar Electric Generating System and Nellis Solar Power Plant. In this research, the changes in landcover are analyzed for pre- and post-installation to understand impact of solar facility construction from 2004 to 2011. A time series of Landsat 5 TM images are used with Principal Component Analysis (PCA), Minimum Noise Fraction (MNF) and Spectral Mixture Analysis (SMA) to estimate the subpixel fraction of each pixel that is covered by four-endmember model; high-albedo, low-albedo, shadow and vegetation. Model validation results show that PCA and MNF have highest correlation coefficients. The results show that solar plant construction has no significant impact on vegetation fraction in the surrounding facility area. In addition, fraction of low-albedo increases and fraction of high-albedo decreases significantly within the facility area.
The prediction of solar radiation is important for several applications in renewable energy research. There are a number of geographical variables which affect solar radiation prediction, the identification of these variables for accurate solar radiation prediction is very important. This paper presents a hybrid method for the compression of solar radiation using predictive analysis. The prediction of minute wise solar radiation is performed by using different models of Artificial Neural Networks (ANN) namely Multilayer Perceptron (MLP), Cascade Feed Forward Back propagation (CFNN) and Elman Back propagation (ELMNN). Root Mean square error (RMSE) is used to evaluate the prediction accuracy of the three ANN models used. The information and knowledge gained from the present study will improve the accuracy of analysis concerning climate studies and help in congestion control.
The RMSE values for MLP, CFNN, and ELMNN are 5, 5.25, and 9.21 respectively. The maximum compression ratio obtained using MLP, CFNN, and ELMNN are 9.8, 9.66, and 7.47 respectively. Conclusively, the Multilayer perceptron (MLP) seems to be the most promising among the other two algorithms as it outperformed the others in RMSE and Compression Ratio.
The hyperspectral imaging plays an important role in remote sensing. Hyperspectral images include both spectral and spatial redundancies whose exploitation is crucial for compression. Most popular image coding algorithms attempt to transform the image data so that the transformed coefficients are largely uncorrelated. In hyperspectral image compression, wavelets have shown a good adaptability to a wide range of data. Some wavelet-based compression methods have been successfully used for hyper spectral image data. In many applications, Karhunen–Loève Transform (KLT) is the popular approach to decorrelate spectral redundancies. In this paper, a review of efficient compression techniques is done, with more emphasis on Binary Embedded Zerotree Wavelet (BEZW), 3D Set Partitioning Embedded bloCK (SPECK) and 3D Set Partitioning in Hierarchical Trees (SPIHT). The Airborne Visible/Infrared Imaging Spectrometer (AVIRIS) was developed by the NASA Jet Propulsion Laboratory in 1987 and provides spectral images with 224 contiguous bands. In our study, we used the standard AVIRIS images – Lunar Lake, Jasper, Cuprite and Low altitude to analyze various methods. The image size used was 225x225x224.
In comparison with the techniques discussed, the BEZW technique with bits per pixel per band (bpppb) of 4.76 and SNR (dB) of 57.96 outperforms other techniques. Also, it has lower computational cost, better performance, high efficiency and simplified coding algorithm.
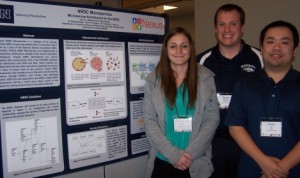
NRDC Microservice Architecture is a redesign of the already existing NRDC service and website that is ran by the Cyberinfrastructure group as a part of the National Science Foundation Track I grant. We are implementing a microservice architecture instead of the current monolithic architecture in order to increase scalability and to make the portal more robust. We have service modules that communicate with a PostGRES database that administers and holds data. These modules are independent of each other and can be replicated to account for times of heavy load on the services. We have also set up a service discovery and monitoring systems through Netflix’s own Eureka load balancing service. Eureka allows us to monitor each individual service for the amount of traffic that it is handling and to balance the load of traffic during times of heavy usage. With this new approach the NRDC will be a much more robust, easier to use system, and provide a sturdy base for storing research data in the state of Nevada.
Workforce Development Posters
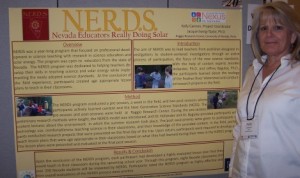
Overview – The goal of NERDS was to offer teachers in Nevada a chance to investigate Solar Energy, Water, and the Environment of the Northern Sierra’s. NERDS combined professional development in science teaching with research in science education. The program had a pre-session, a week of field work, and two post-sessions which included content about the area where they would be doing their research during the summer and classroom assessment of inquiry-based activities. NERDS was dedicated to helping teachers develop their skills in teaching science and solar energy while implementing the newly adopted science standards.
Introduction – The aim of NERDS was to lead teachers from participant-designed investigations to student-centered lesson plans and projects through an active process of participation. NERDS also focused content and lesson plans based on the new science standards.
Method – The NERDS program meets for a pre-session, a week in the field, and a two post-sessions. The pre-session and post-sessions were held at Raggio Research Center, the fieldwork was in the Northern Sierra’s in Graeagle, California. During the pre-session preliminary research data was collected, teachers were introduced to the NERDS model, and content about the environment where the summer research would take place was presented. The fieldwork was conducted on July 21-26th, teachers learned skills such as orienteering, sampling methods, and using keys to identify organisms, in order to work in small groups to plan and carry out an investigation in the field and communicate their results to larger groups. When teachers returned to their classrooms they planned and implemented a lesson plan incorporating the skills they learned in the field. The two post-sessions consisted of learning to assess the inquiry process, sharing unit/lesson plans, grade-level curriculum connections, and developing strategies for application of the NERDS experience in the classroom.
Results & Conclusion- Both NERDS teacher groups developed high-quality lesson plans that will be used in eight separate classrooms in Northern and Southern Nevada. The results from the pre/post assessments were not significant, but this could be due to the small number of participants. Overall, the participants evaluated the NERDS program highly.
Overview- The goal of SCIP was to provide students with opportunities to observe research and career presentations by STEM professionals in a wide array of specialties in order to understand how the STEM disciplines are integrated. Each week, a professional in a STEM field presented their research projects and discussed future job possibilities and academic preparation for someone with their area of specialization. SCIP aimed to encourage students to pursue a degree in STEM, which in turn could increase the amount of professionals in STEM fields in the future.
Introduction- The aim of the study was to assess the effectiveness of the SCIP program in regard to increasing participants’ positive attitudes toward STEM fields and obtaining STEM degrees. The significance and value of the research was to assess if the SCIP program would encourage participants to pursue a STEM degree in college.
Method- To SCIP program was conducted with six sessions to introduce participants to various careers and research projects in STEM fields. Six separate speakers, each with a different degree and career, discussed their educational background and current research. A pre/post survey given at the beginning of the first session and the conclusion of the final session was used to assess participants’ attitudes toward STEM fields (Tuan, Chin, &Shieh, 2005). A survey was given at each session to assess the effectiveness of each speaker.
Results and Conclusion- Thirty-two students completed the pre/post assessment. Pre-test :(M= 4.15, SD= 0.40, N=30); Post-test: (M= 4.28, SD= 0.35, N=30); the difference was significant at the .05 level, t(29) = -2.46, p = .02 (significance level p=<.05). All six presenters were evaluated on a four-point Likert-scale. The scores for the presenters were between 3.38 and 3.62. The results from the pre/post assessment concluded that SCIP increased participants’ positive attitudes toward STEM fields. SCIP will have an impact on the amount of students pursuing STEM degrees in college.

